
tl;dr #
- We reproduce all three core claims of Stevinson et al. from their toy classifier setting:
- PGD attacks against toy models generally agree with theoretically optimal solutions.
- Toy models without superposition are less vulnerable to attacks. Robustness falls monotonically as superposition increases.
- Attacks transfer between independently-trained models because feature geometries can converge across training runs.
- Similar to what’s reported by Elhage et al., 2022, we notice that co-activating features can collapse onto a shared direction instead of orthogonalizing.
Our code can be found here and we encourage readers to fork/run followup experiments!1
Background #
Elhage et al., 2022 defines superposition as the phenomenon where “models represent more features than they have dimensions.” To study this in a toy setting, they define a classifier where $k$ features are squeezed into an $m$-dimensional bottleneck with $m < k$, so feature directions interfere in the latent space.
Stevinson et al., the origin of the experiments in this replication, argues this interference is a mechanism behind adversarial examples. The paper makes three claims: 1. adversarial attacks exploit interference, 2. models without superposition are more robust to adversarial examples, 3. correlations in the input data allow models to converge to similar geometry, allowing adversarial attacks to transfer between models.
Toy Model and Notation #
The experiments in the paper deal with a toy model with encoder $W_e \in \mathbb{R}^{m \times k}$ and decoder $W_d \in \mathbb{R}^{k \times m}$. For input $x \in \mathbb{R}^{k}$ the output is $y = W_d W_e x \in \mathbb{R}^{k}$. Here $k$ is the number of classes and $m < k$ is the bottleneck width forcing the features to be condensed into a lower dimensional space before reconstruction. This gives us a convenient architecture to study superposition: a large ratio $k/m$ means the model has to do more compression, while if $k/m = 1$, the model can represent each feature with its own direction.
The model uses cross entropy loss. Features are sampled independently with probability $1 - s$, where $s$ can be thought of as how sparsely features are activated within the data.
Adversarial attacks are computed by projected gradient descent (PGD) (Madry et al., 2019). For a given sample $x$, the adversarial example $x_\text{adv}$ is found by PGD, where $\delta = x_\text{adv} - x$ indicates how the attack modified the original sample. $|\delta|_p$ measures distance between the original example and the adversarial example and $\varepsilon$ is the attack budget which enforces that $|\delta|_p \leq \varepsilon$. We use PGD learning rate $\varepsilon/4$, at 50 steps with 5 restarts, and $\varepsilon = 0.2$. The values for $k$ and $m$ vary but unless otherwise stated $k = 7$ and $m = 2$.
We follow the hyperparameters described in the paper as of July, 2026.2
Attacks Exploit Interference #
Stevinson et al. hypothesize that adversarial attacks in toy models work by exploiting the interference geometry. Proposition 1 from the paper shows the optimal perturbation has a closed form solution:
$$\delta \propto W_e^\top (w_t - w_s) \tag{1}$$
where $w_s, w_t$ are the source/target class vectors (rows of the decoder $W_d$) and $W_e$ the encoder, scaled to the $\varepsilon$-ball. The authors test if the PGD perturbation matches the optimal attack derived from interference geometry, empirically by:
- Performing untargeted attacks on the toy model.
- Taking the set of successful attacks (an attack is successful if the prediction flips and the true label stays unchanged).
- Finding the optimal targeted attack for target class $y = W_d W_e x_\text{adv}$ using Eq. (1) above and calculating the cosine similarity with $x_\text{adv} - x$.
At a high level, this can be thought of as letting the attack maximize loss in an arbitrary direction and testing if it finds an optimal direction for a given target class. Figure 1 shows the untargeted attack live where $k = 7$ and $m = 2$. Each arrow is one PGD step in the encoder’s latent plane, the dashed outline is the reachable set (the encoder image of the $\varepsilon$-ball), and the shaded regions show which class the decoder assigns (the attack succeeds when the activation is pushed across a decision boundary).
We use untargeted attacks for these experiments to follow the methodology of the paper, but we also repeat this experiment for targeted attacks with results in Appendix A.
The claim that the PGD attack aligns with the optimal attack, exploiting the interference geometry, replicates cleanly on the toy model. With sparsity 0.98, we demonstrate that PGD attacks align with optimal perturbation. We believe our cosine similarity results are higher since we let PGD iterate to find the best perturbation while the paper stops at the first prediction flip.
| k | m | clean acc | PGD·optimal (ours) | PGD·optimal (paper) |
|---|---|---|---|---|
| 6 | 2 | 0.998 | 1.00 | 0.97 |
| 30 | 10 | 0.996 | 1.00 | 0.96 |
| 90 | 30 | 0.966 | 1.00 | 0.92 |
Like the original paper, we ablate on randomness by calculating the cosine similarity between our optimally successful PGD attack and a random direction within the $\varepsilon$-ball, and confirm on average that the cosine similarity between random directions and our PGD attack lands around 0.
As an additional stress test, we repeat our ablation while only selecting random directions that result in a successful attack, isolating the comparison between the PGD attack and random, successful attacks. These can yield non-zero cosine similarity scores, but the PGD attacks still align better with the optimal solutions.
| k | m | random direction | random direction filtered by successful attack |
|---|---|---|---|
| 6 | 2 | 0.015±0.028 | 0.639±0.006 |
| 30 | 10 | 0.003±0.007 | 0.432±0.003 |
| 90 | 30 | 0.002±0.002 | 0.213±0.07 |
No Superposition, Little Vulnerability #
Stevinson et al. claim that toy model adversarial vulnerabilities disappear along with superposition. We observe the same trend with robust accuracy falling monotonically as superposition pressure rises. When $k = m$ (all features can be orthogonal), robust accuracy grows to 93.4%.
Some of the magnitudes we report diverge. At $m = 2$ our model stays more robust than the paper’s because we train for 20k steps while the paper only trains for 5k steps. At $m = 5$ our robust accuracy is lower than the paper since we give PGD random starting positions, bigger steps, and 5 restarts to find a better attack, which is a setting stated in the paper but missing in the authors’ code.
| k/m | paper m=2 | released code m=2 | ours m=2 | paper m=5 | released code m=5 | ours m=5 |
|---|---|---|---|---|---|---|
| 1 | 98.7 | 98.6 | 100 | 92.0 | 95.0 | 97.3 |
| 2 | 75.8 | 80.1 | 79.5 | 87.2 | 97.0 | 70.5 |
| 3 | 31.0 | 34.3 | 50.4 | 59.0 | 66.4 | 50.6 |
| 4 | 11.1 | 11.4 | 18.7 | 33.5 | 36.7 | 30.1 |
Shared Geometry Drives Transfer #
Stevinson et al. claim that input correlations shape the learned feature geometry, and attacks transfer between independently-trained models to the degree their geometries converge.
We train independent models under three correlation regimes:
- Uncorrelated: features activate independently
- Paired: paired classes activate at the same time
- Global: adjacent classes frequently co-activate, specifically:
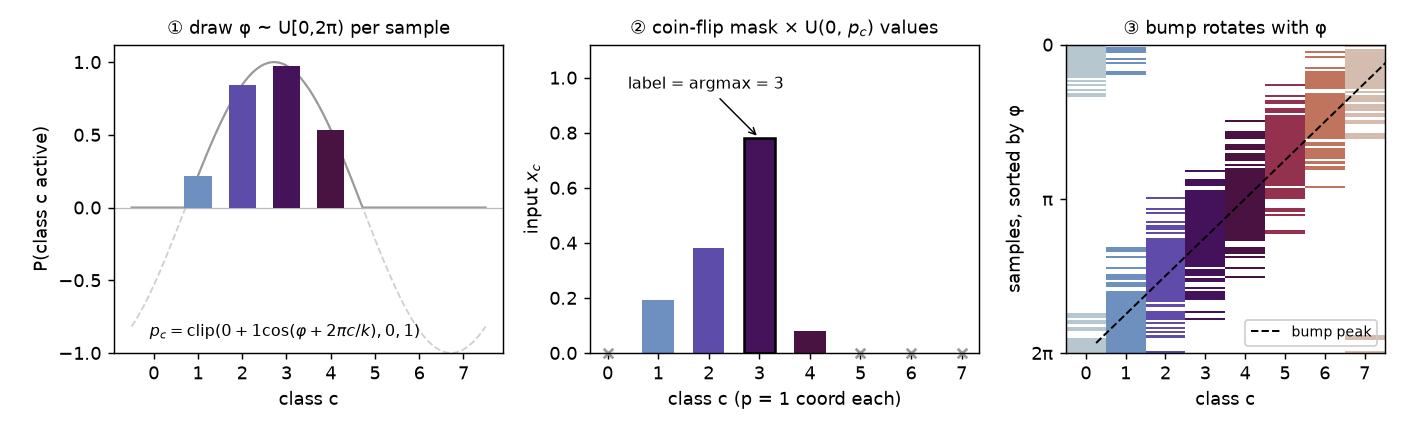
- Each sample draws a phase $\varphi$; class $c$ activates with probability $0.5 + 0.5\cos(\varphi + 2\pi c/k)$.
- Active classes get $\text{Uniform}(0, 1)$ values; the prediction label is given by argmax.
- This process makes index-neighbors more likely to activate together. This incentivizes geometry to converge across seeds.
We see the same trend where both geometric similarity and attack transfer rate grow as the correlation of input increases.
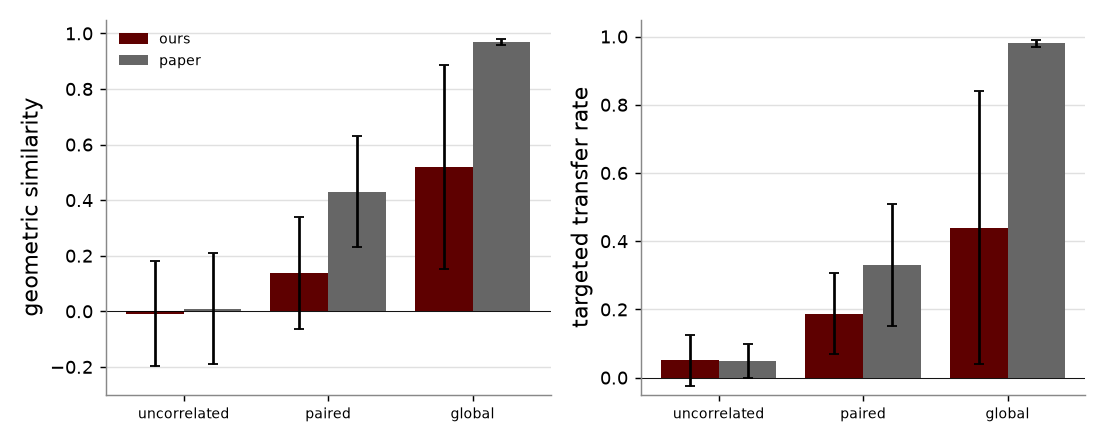
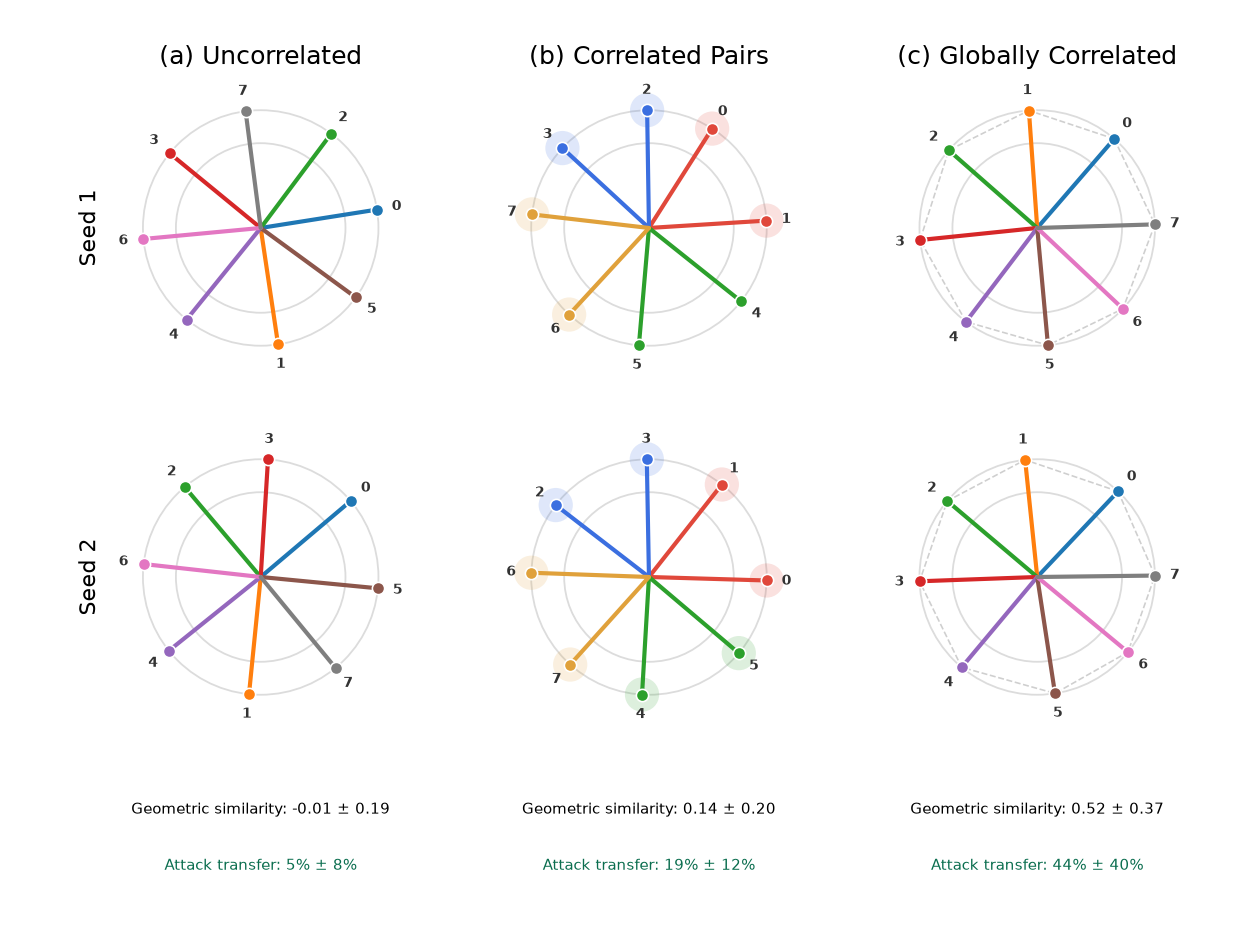
Figure 4 shows the geometry between the two seeds. As expected, uncorrelated arrangements are random to each other and unrelated between models.
For the other two settings, we observe an interesting phenomenon: correlated features tilt toward each other rather than orthogonalizing. We dive into it in the next section.
Similar geometry and attack transfer are verified on regimes with larger input space. As we stated above, there is a magnitude gap for the paired and global settings due to different parameter choices.
Beyond Replication: Orthogonalize or Collapse? #
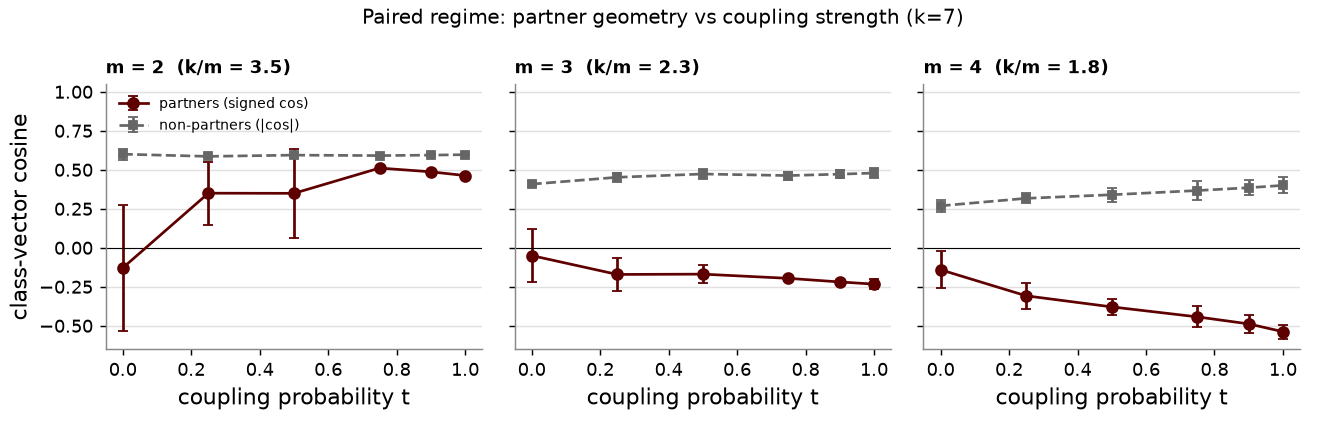
What do co-activating features do to each other’s geometry? We sweep the paired regime’s coupling probability $t$ (partner fires with probability $t$ when its mate fires) across bottleneck widths.
When $m = 2$, as the coupling probability $t$ rises, partners swing together and collapse onto a shared axis, until every pair has merged into roughly three directions. With capacity slack ($m = 3, 4$) partners stay near-orthogonal or in avoidance at every coupling; at $m = 2$, partner cosine crosses above the baseline near $t \approx 0.75$ which is the collapse regime.
This tells us latent space geometry is constrained by paired activation. With sufficient model capacity, paired features tend to orthogonalize; however, when capacity is lacking, they collapse to a fixed angle.
Appendix A #
We perform targeted attacks on every ordered class pair $s \to t$ (where we minimize the cross entropy loss of the target class). We verify that these attacks align with the optimal direction with cosine similarity higher than 0.96.
This holds for both successful and failed attacks. Even when $m = k$, where orthogonal geometry prevents vulnerability, the attacks precisely match the optimal perturbation but fail to breach the decision boundary.
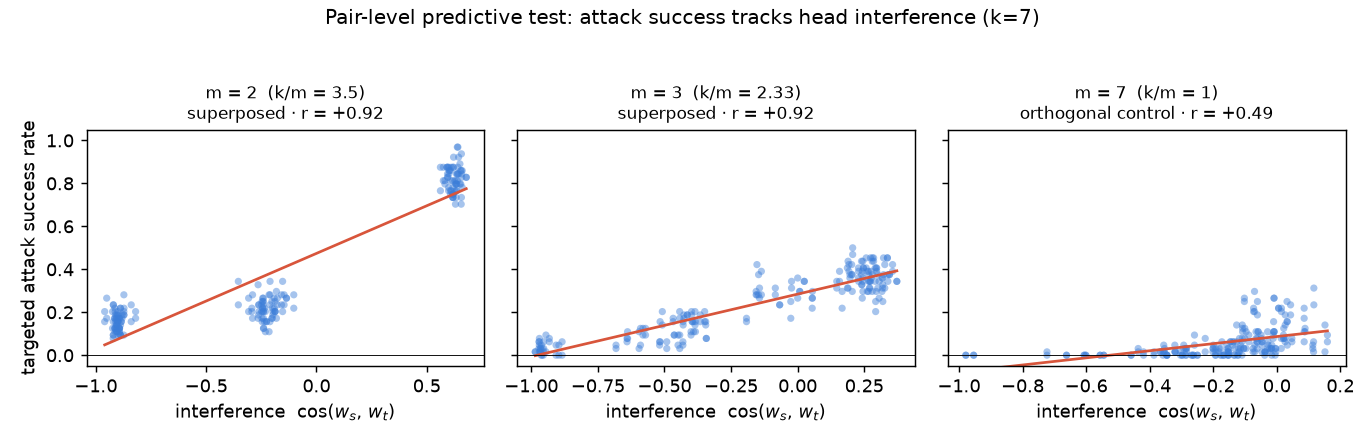
We demonstrate that attack success tracks head interference as shown in Figure 6. Geometry predicts vulnerability pair by pair, not just on average.
-
This research is supported by the Second Look Research fellowship. ↩︎
-
For training details that weren’t specified, we make reasonable assumptions and in cases where results looked qualitatively different, we investigated further or contacted the authors. ↩︎